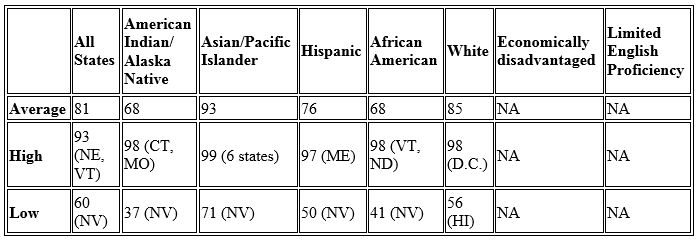
The number of high school dropouts—approximately 15% of the 16- to 24-year-old population—represents a national crisis with huge personal and societal consequences. In Building a Culture of Hope (2013), Dr. Robert D. Barr and I described the high school dropout crisis in detail using data from 2009–10. At that time, the national graduation rate was hovering near 74%. The release of data for the 2011–12 school year indicates the national graduation rate has risen to 80%, with 27 states having graduation rates above 80% (US Department of Education, 2014). While average graduation rates across the nation are steadily increasing for all subpopulations, average graduation rates hide the persistent gap between demographic groups, especially for students who are poor, minorities, limited English proficient, or students with disabilities. This blog post focuses on understanding current high school graduation rates.
Before discussing the actual data, it is important to understand how graduation rates are calculated. There are two main methods: the Average Freshman Graduation Rate (AFGR) and the four-year Adjusted Cohort Graduation Rate (ACGR).
- AFGR is the number of graduates divided by the estimated freshman enrollment count four years later. (This count is the average of the number of students for this cohort when they were in 8th grade, 9th grade, and 10th grade.) The AFGR is the most commonly used statistic, especially when looking at longitudinal data.
- ACGR is the number of students who graduate in four years with a regular high school diploma, divided by the number of students in the graduating class’s adjusted cohort (adding students who transfer in and subtracting any students who transfer out, immigrate to another country, or die). The ACGR is the federally required graduation data as of 2010–11.
The ACGR is the most accurate statistic, but the AFGR can be estimated for the past 50 years, making it highly useful for comparisons over time. It is important to note that both methods fail to include students who are not dropouts, but who are also not considered on-time completers (i.e., students who repeat a grade, students who earn an alternative credential, and students enrolled in diploma/AA degree programs which often require more than four years to complete). Thus, the dropout rate is not merely the graduation rate subtracted from 100%, as it is often erroneously reported.
What may not be obvious is how the often the two calculations differ from each other, as seen in the two charts below (data from Stester and Stillwell, 2014. For full data charts, see U.S. Department of Education).
ACGR Percentages, 2011–12
AFGR Percentages, 2011–12
Even within states, the two measures often differ widely, with some states having nearly the same graduation rate in each measure (see VA and MO), while others have differences of 10 or more percentage points between measures (see DC and OR).
Comparison of AFGR and ACGR Percentages at State Level
Whether you use AFGR or ACGR rates, it is clear that the national high school graduation rates have improved. Building a Grad Nation reports that for the first time the national ACGR is at 80%, with many states on track for reaching 90% graduation rates by 2020 (Balfanz, et al., 2014). Of the 3.8 million students who began high school as freshmen in 2008, 20% (or 760,000) failed to graduate on time. In some articles, I have seen the statement, “3/4 of a million students dropped out in the class of 2012,” which is inaccurate. That 20% includes students who are in GED programs, students who earned alternate diplomas, students who are earning an alternate degree, and students who may take five or six years to graduate instead of four (Diplomas Count, 2014).
In most parts of the US, a Native American, Hispanic, or African American child still has a much lower probability of graduating on time than a white or Asian American child. A child living in poverty has a lower probability of graduating, as does a child who is learning English as a second language or a child with learning difficulties. The good news is since 2002 there are 200 fewer dropout factories (schools with graduation rates below 60%), which means nearly 450,000 fewer low-income and minority students are attending schools where they have a 50/50 chance of graduating (Balfanz, et al., 2014). Unfortunately, our nation still funds over 1,300 dropout factories and low-income and minority students—especially young men of color—still graduate at rates under 60% in most urban schools (Balfanz, et al., 2014).
What is perhaps most sobering about the dropout crisis are the potential life outcomes for dropouts—approximately 15% of the adult population. In Child Trends (2014) data from 2011, two items stand out: dropouts are not eligible for 90% of the jobs available and dropouts commit 75% of US crimes. These statistics paint a stark picture; dropouts, who have very limited job opportunities, commit three of every four crimes.
With statistics like these, it is hard to know where to begin working toward solutions. Reports on the dropout crisis from groups like America’s Promise, Building a Grad Nation, Achieving Graduation for All, and Diplomas Count share strategies for increasing attendance and achievement in high schools. There is an amazing degree of commonality in the solutions offered and implemented by these and other groups—including the elevation of social and emotional components to parallel importance with academic and disciplinary components. Increasingly, students’ needs for belonging, optimism, hope, pride, and purpose are being discussed. Leaders and decision makers realize that students are more likely to stay in school when they feel they belong there, and they are more likely to graduate and continue on to careers and college when they have a guiding purpose for their lives and schooling. Transforming the high school experience for students and teachers requires this emphasis on social and emotional learning. Students need a Culture of Hope!
[author_bio id=”112″]


